COVID-19 and face-to-face classes: how the numbers stack up
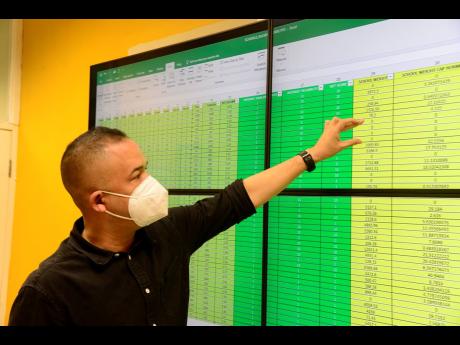
After three weeks of poring over head-scratching numbers and permutations, Dr Parris Lyew-Ayee Jr is just about done collating the data he needs to craft a road map to face-to-face engagement in the COVID-19 era.
Then comes the hard part: piecing together a complicated puzzle that could see the geographic information system (GIS) measuring risk profiles for every student and school.
Lyew-Ayee, director of the Mona Geoinformatics Institute (MGI), said on Thursday afternoon that he was in the final stages of assessing water and sanitisation among several indices determining coronavirus vulnerability in the reopening of individual schools.
He said that he was about 30 per cent through pulling together parts of the project.
Lyew-Ayee was recruited by the Ministry of Education to use GIS, as well as demographic and health data, to create a model to drive the safe reopening of schools.
But the education ministry backpedalled on its phased plan for face-to-face classes to start on October 5 after a noisy rebellion by principals, teachers, and the National Parent-Teacher Association of Jamaica.
The initial declaration was made after a meeting with more than a dozen stakeholders on a government-installed e-COVID Task Force.
The MGI director, who took some flak for criticising the swift repudiation of GIS, said in a recent interview that geoinformatics answers fundamental questions of everyday life.
“You want to know where is something? Where should I go? Where must I not go?
“... It tells you where and then answers questions why, when, and how,” Lyew-Ayee said.
The data analyst stresses that when policies affect people’s lives, it is imperative for them to know how where they live affects how they live.
Using data gathered from the education ministry, he is generating a large database that will form the foundation of the model.
The data are also disaggregated by grade level.
Lyew-Ayee shared that a data-driven approach allows for the measurement of information that people would not typically include in decision making.
Schools, he said, must be viewed through the lens of people as well as the physical plant.
Lyew-Ayee said the plan will assist the ministry in prioritising and determining how much funds should be allocated to each school, based on its unique situation, noting that one size does not fit all.
“You cannot have one plan, one budget for all schools. Some schools are better off than others on the basis of enrolment, Internet, water, or COVID risk.
“That’s how you’re going to equitably distribute money - based on need and based on numbers,” he pointed out.
Lyew-Ayee continued: “... The human side of schools – students, staff, capacity – but you also have elements such as how far they travel to come to school. How many communities do they pass through? How many of those communities have COVID or other issues?” he said.
Among the other data gathered is whether schools have a COVID-19 protocol in place, an isolation room, sanitation facilities, spacing, and other easily measured variables such as water supply and Internet connectivity.
REVEALING FACTS
Lyew-Ayee is still in the data-collection phase and is already seeing some “very revealing facts”.
For example, students of Denham Town High School travel, on average, 1.5 kilometres and pass through 40 communities, while students of Merl Grove High travel seven kilometres on average and pass through 160 communities.
This differs significantly for students of Comfort Castle Primary and Junior High in Portland, all of whom live in the community – the pattern of a small, rural school.
The MGI director added that the ratio of students enrolled to capacity shows that some schools have available space while some are bursting at the seams.
So far, the only challenge in the data-gathering process is that the addresses of some students are not specific.
He added that the next step is to overlay the data with public-transportation means and routes.
Work on the COVID-19 school-vulnerability index is similar to the institute’s yearly analysis of road crashes.
“It is the same consideration as road safety – the mobility element. People who travel far, by mathematical definition, have a greater chance of being a road-safety victim because they are on the road for longer stretches of time,” said Lyew-Ayee.
“In the case here with COVID, if you are travelling 20 or 30 kilometres to school and changing buses in Half-Way Tree, that is a lot of opportunity for you to mix up, get infected, and spread it to schools or home.”
Lyew-Ayee said that his role is merely “to activate the data into something that can be useful - making sense out of what you already know in a measurable, quantitative way”.
After that, Education Minister Fayval Williams and her policymakers will have the hard task of selling it to sceptical teachers and parents.

